Will mortgage rates paint the Fed into a corner?
In recent weeks we have talked often about the tightening of lending standards, the possibility of the end of dot plots, and especially the shape of the US yield curve – today’s blog encompasses all three.
Last week we noted at our asset allocation meeting that US mortgage spreads (the difference between 30-year mortgage rates and 30-year US Treasury yields) were at worrying levels.
Chart 1: US 30Yr Mortgage Rates vs 30Yr US Treasury Yields vs Fed Funds (Source: TwentyFour)
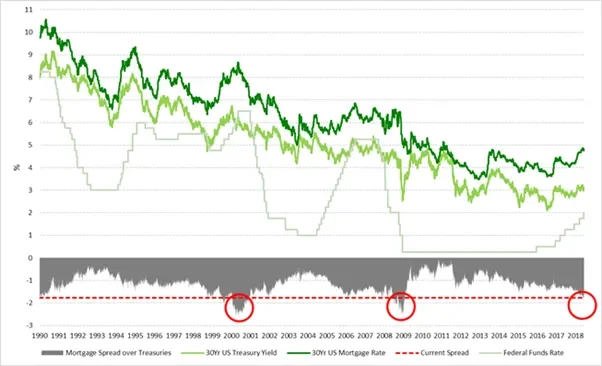
Since 1990, there have only been two instances when mortgage spreads were as wide as their current levels: the credit crunch and the tech crunch (highlighted with the red circles above). This alarmed us to say the least, though mortgage rates themselves are still low in an historical context (albeit now at their highest level in seven years and close to breaching 5%).
What is driving this? Initially we theorised that as the Fed Funds rate has risen (seven times in this cycle now), the ability of households to refinance their mortgages has diminished, and therefore banks have been able to pass through bigger margins to those still in-the-money to switch. However, the data does not confirm this.
Chart 2: Turnover speeds versus existing home sales (Source: Bank of America, Agency MBS Alert, 13 June 2018, Pg. 10)
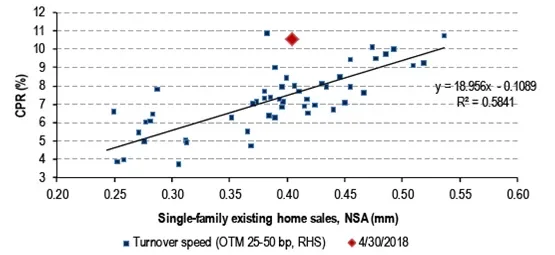
Instead, it appears that mortgage prepayments are running at an unusually high rate for the volume of existing home sales. An alternative theory is that as short rates have risen, future prepayment rate expectations are lower, resulting in higher mortgage insurance costs for ‘longer’ loans, and when this is incorporated into the all-in mortgage rate, the impact is visible in mortgage spreads.
Whatever the drivers, the consequences could be stark, and we think have the potential to further box in the Fed when it is already getting close to the edge.
We know the Fed is committed to keeping pressure on short rates, and that they recognise the yield curve is perhaps flatter than it should be given the robustness of the US economy. So if they either talk down the long end, or perhaps engage in a reverse operation twist to keep the longer end of the yield curve steep with a decent term premium, won’t that mean further pressure on mortgage rates?
Indeed it will – and with mortgage spreads already at crisis levels, we think the Fed will have a very difficult job managing through this in the next 18 months. Can they persist with the rates profile shown in the dot plots? Is the alternative of slowing down the rates profile to protect mortgage rates likely to lead to an inflation shock and therefore an even steeper curve?
Traditionally it is the Fed that ends the cycle. This cycle is already getting long in the tooth, and the challenges facing the central bank are significant – now the additional challenge of mortgage spreads and rates further paints the Fed into a corner that is becoming very tight.
About the author

About the author


