Highest starting yields since ‘08 predict strong five-year returns
Three years ago I did some analysis on the ICE/BAML US Broad Market Index of government and corporate bonds, and found that the starting yield explained pretty much all of the future returns, when you had an investment horizon of 5 years.
In summary, I found that by looking at total returns over rolling 5yr periods, the yield of that index on the very first day of the 5yr period ended up explaining more than 90% of the subsequent return, as shown below (R2 was 0.9166):
5Yr Annualised Return vs Starting Yield, US Broad Market Index, 1975-2019
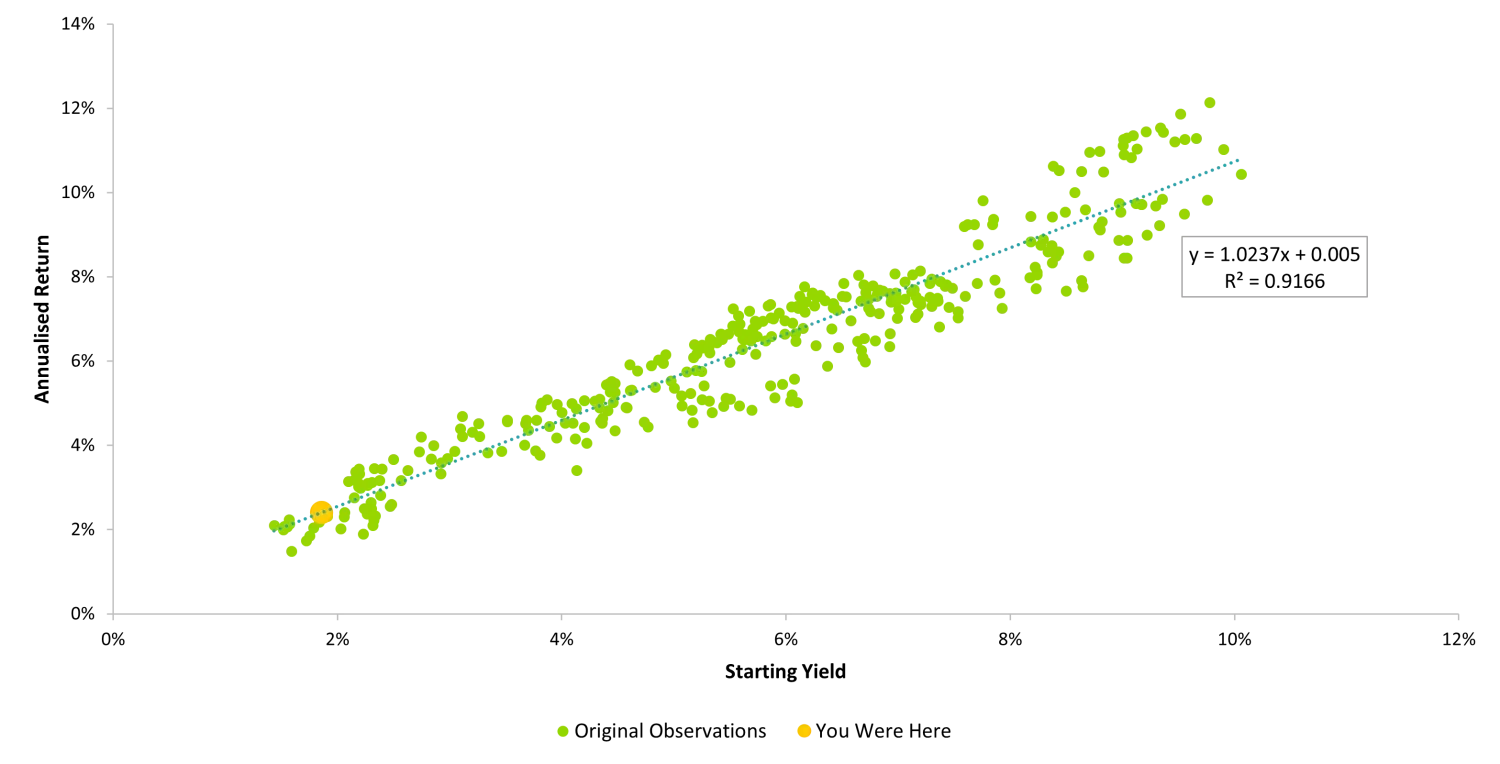
Source: TwentyFour using ICE/BAML data
The problem? At that time, starting yields were amongst the lowest in that data series’ history (see ‘You Were Here’ orange dot in Chart 1). This showed that with data going back to 1975, having such a low starting yield predicted that subsequent 5yr returns were likely to be poor.
Fast forward three years, and once again they have proven to be poor in recent times with cumulative returns over the last 5 years having been the worst in this dataset’s history. In fact, the last two months’ worth of rolling 5yr returns, for periods ending September 2022 and October 2022, have both been negative. This is the first time this has happened since the index start date in 1975.
As you can see from chart 2 below, the blue dots show the 5yr rolling return vs starting yield observations over the last three years since my original analysis.
5Yr Annualised Return vs Starting Yield, US Broad Market Index, 1975-2022
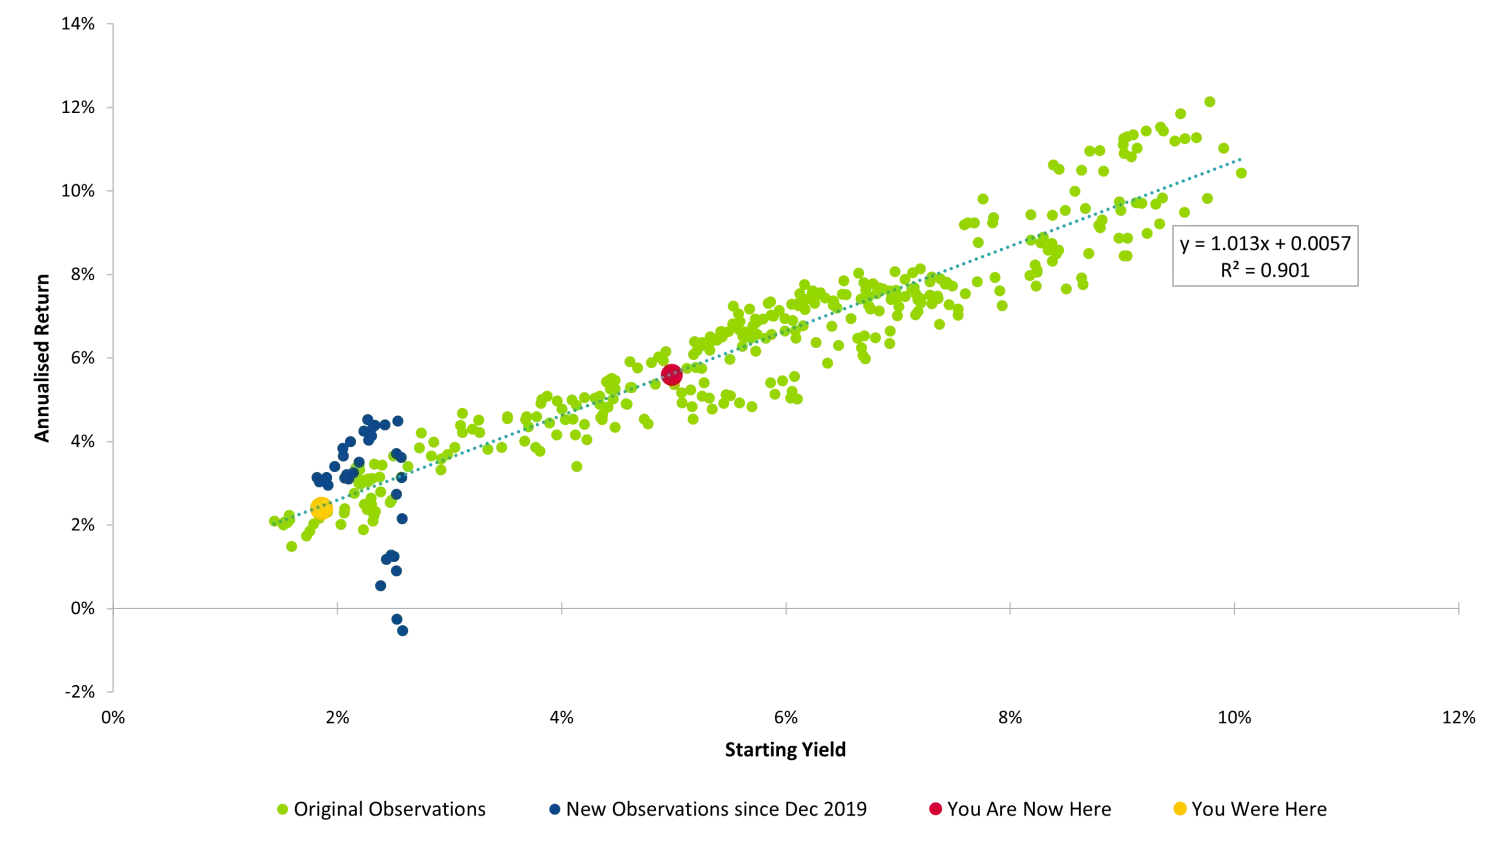
Source: TwentyFour using ICE/BAML data
Many of those blue dots above have the worst 5yr cumulative returns of this entire dataset, and the last two month ends from 2022 we looked at (September and October) have both seen negative returns – never seen before.
The only good news from this updated analysis however is that the orange dot (“You Were Here”) has now become the red dot (“You Are Now Here”)…predicting improved returns over the next 5 years from the much higher starting yield we have now. For context, October 2022’s month end yield for this index was 4.98% - the highest since November 2008.
In simple terms, all of the yield collapse we saw during the 13 years of Q.E. has been reversed by what has happened this year – the worst year for bonds in living memory.
Given we now have yields equivalent to the pre-Q.E. period for this century, and with an R2 of 0.901 with the fuller dataset, that starting yield of 4.98% predicts annualised average returns of 5.61% for a five year holding period.
Of course, that is not to say the next 5 years of bond market returns will come without volatility attached: by contrast we fully expect volatility will remain elevated for some time. But what we can say with confidence is that if your holding period is 5 years, we think you can now be confident of a 5.5%+ annualised return, giving you more than 28% in total return terms.
But what if your investment horizon is less than 5 years? Well we think the higher starting yield argument still holds, but with global recessions in 2023 looking very likely, rather than allocating to a broad index of all maturity bonds, perhaps staying closer to home with short dated maturities could be a better way of accessing those higher yields. With inverted yield curves beyond the 2yr maturity point, in fact we think staying shorter dated actually maximises the yield opportunity, whilst also lowering capital risks in what is likely to remain an uncertain environment for many assets and asset classes.
In fact, short dated bonds may well be the best game in town for the next year or so.
About the author

About the author


