Don't forget about money supply measures M1 and M2
Money supply measures such as M1 and M2 enjoyed a relatively brief period of fame and glory just after the pandemic. In previous episodes of Quantitative Easing (QE) it was the most basic money measure that grew significantly, that is Monetary Base (or M0). This is comprised only of currency in circulation plus the banking sector reserve balances with the central banks. M1 includes currency in circulation plus demand deposits and other liquid deposits. M2 includes M1 plus small denomination time deposits and retail money market funds.
When a central bank buys a government bond from the public, most of the time it does so through a bank who act as an agent of sorts to facilitate the transaction. The end result is that the central bank grows its balance sheet via a new asset (the government bond they bought) matched with a liability (the increase in reserves they create in order to pay the agent bank). The agent bank on the other hand now has more reserves with the central bank on the asset side of the balance sheet, and this is matched with a deposit on the liabilities side they created to pay the public for their bond. As a result the public lost the government bond and now has a deposit instead, with no effect on the balance sheet aggregated amounts.
M0 therefore increases mechanically with QE. M1 and M2 increase indirectly as well but there are other variables that might work in the same or opposite direction. In particular, when a loan on the banking sector’s balance sheet is repaid, that loan disappears from the asset side of the balance sheet. This is matched by a deposit previously owned by the borrower also disappearing. In the aftermath of Lehman, the banking sector was deleveraging, i.e. not giving out as many loans as previously, while the consumer was paying down debt. These effects meant that although M0 increased, M1 and M2 didn’t really. This is a reflection of poor sentiment and low or negative growth, which are disinflationary by nature.
In the pandemic, QE programmes had the same effect as before on M0. This time around though, with banks and consumers in good shape, there was no destruction of loans on banks’ balance sheets. Quite the opposite. Companies drew on their credit lines and banks were there to honour their commitments. With no offsetting effect, M1 and M2 increased steeply resulting in more money chasing reduced baskets of goods and services as a result of disruptions in the supply chains.
On top of that, the fiscal stimulus we saw was enormous. Taking the US Treasury as an example, when they issue debt, savers buy US Treasuries through an agent bank for which they pay with a deposit. On its own, this drains deposits out of the system. However, when this happens at the same time the Federal Reserve (Fed) is in a QE programme, the net effect on deposits will depend on the magnitude of the newly issued US Treasuries vis-a-vis the amount the Fed is buying. Between March and June 2020, the Fed’s balance sheet increased by $3 trillion while the Treasury General Account (TGA – which is like the current account of the Treasury with the Fed where they keep their cash) increased by “only” $1.2 trillion. The net effect was therefore a very large increase in deposits. Lastly, when the Treasury spends those monies on goods, services or transfers to consumers then the monies return to the economy in the form of new additional deposits. All that new money chasing goods and services had an important effect on inflation.
What has happened to M0, M1 and M2 since then? Broadly speaking, the answer is that they are no longer growing as they did in the pandemic days. The most interesting observation in our opinion is the comparison of pre pandemic trends in M2. The graph below shows M2 data for the US and Europe. As can be seen, M2 in Europe is almost back to the pre pandemic growth trend. Whereas in the US, M2 would have to decline by just over 10% to get to the same trend. This highlights that the nature of the inflationary shock in Europe was a bit different to what we saw in the US. The supply side shock of the energy crisis played a very large role in Europe while in the US the inflationary issues have been more demand driven, as the stimulus packages were larger and the economy is more dynamic.
US and Eurozone M2
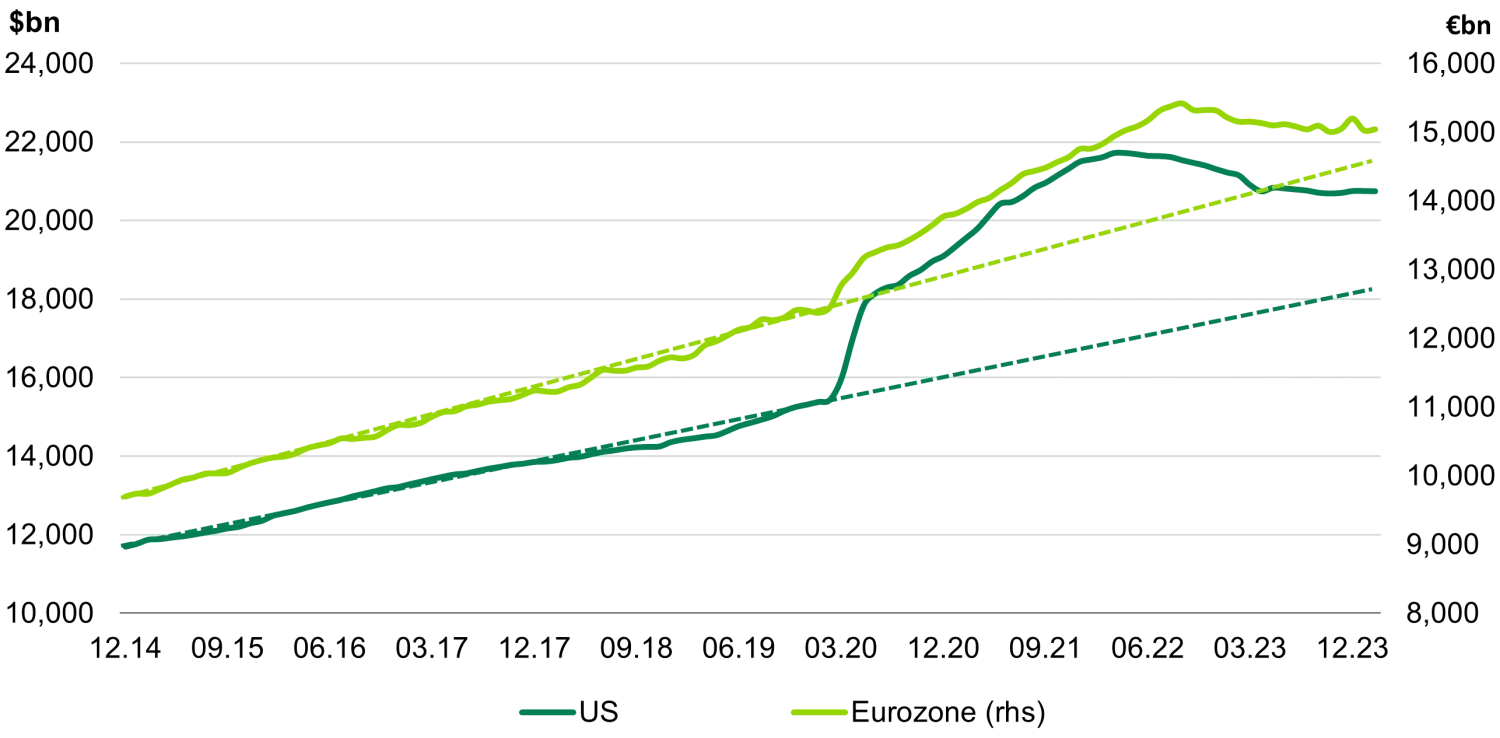
Source: Bloomberg
Monetary aggregates are certainly not the only data that explains inflationary pressures, and returning to pre pandemic trends is not a guarantee of anything. But we do note that M1 and M2 growth seem to have played an important role in the recent inflationary shock and the growth divergence between the US and Europe. Part of said growth differential has to do with the US economy being more dynamic and the energy crisis as a result of Russia’s invasion of Ukraine that hurt consumers’ confidence and pockets in Europe. But we think a large part can also be attributed to the much larger fiscal deficits post pandemic, which is reflected in the respective M1 and M2. Added to this there is growing unease in the investment community with US fiscal deficits as there seems to be little intention of straightening the situation by either Republicans or Democrats. These fiscal deficits appear to be unsustainable in the long run meaning at some point the deficit is likely to decline and that will impact growth. Regarding inflation, while we do think that eventually the Fed will be able to achieve their target and the amount of money in the economy will return to the pre pandemic trends, the timing of these events is a bit more uncertain than in Europe.
About the author

About the author


