Of averages, medians and Fed funds rates
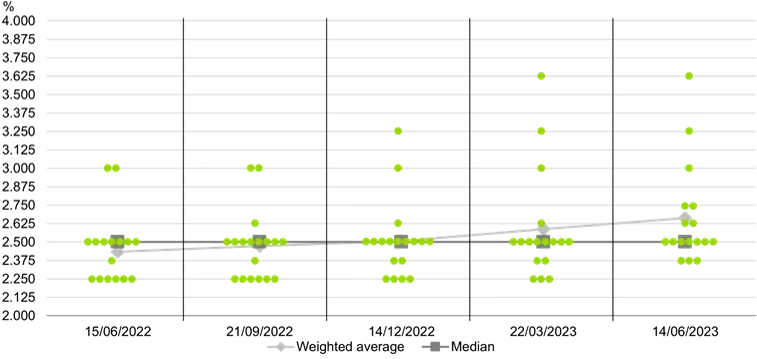
The so called “dot plots” published by the Fed every quarter gather a lot of attention for obvious reasons. They give market participants an indication of FOMC members’ views on a range of topics including the outlook for short term rates. One less popular parameter they also give indications about is the Longer Run Fed Funds Rate; this is the long term “projected appropriate policy path”. Market participants take this to be the neutral rate at which monetary policy is neither expansionary nor contractionary. The relative lack of attention to the long run rate does not have its roots in a lack of economic relevance but rather in the fact that it has barely deviated from a median value of 2.5% since June 2019. The only change in the median since then occurred in the March 2022 dot plot, where it fell to 2.375% only to come back to 2.5% in the following release. We think this long run projection might be back in vogue in the next few quarters as the median long run rate is likely to move higher.
The fact that the median long run rate has not moved does not mean individual members’ dots haven’t done so; in reality they have moved quite substantially as the chart below shows. Important to note that we are only showing a few quarters but actually the dot plots started in 2012 with a median projected long run rate of 4.25%! Our first observation is that the range has increased in width reflecting how uncertain the economic situation is at the moment. For a number of quarters individual dots were in the relatively narrow 2.5% to 3% range. In March 2023 the range was significantly wider 2.25% to 3.625%. The second observation is that projections are starting to move up. The lowest dots are no longer at 2.25% but at 2.375%. Bear in mind that this happened while the more widely reported median number is still at 2.5%. The median of a discrete distribution is the number which splits the distribution into two halves with the same number of observations after sorting them in an ascending (or descending) manner, which in this case is 2.5%. It’s an interesting number but does not show the full picture. For example, if in September’s projections the three dots currently at 2.375% (highlighted in the 14.06.2023 chart point below) moved up to 2.5% to join the existing seven for a total of ten, then the median would not move from 2.5% even if all the remainder dots currently above 2.5% moved higher. The average, however, would move higher. In fact it has already increased from just under 2.5% to 2.662% which is the highest since June 2019.
Fed long run IR projections
Source: Bloomberg - June 2023
The change seems small but we believe it is significant and the weighted average is likely to continue moving higher. Inflation expectations, while not running away and in that sense still anchored, have found a level at a higher number than in the previous cycle. The Michigan “next 5-10 years inflation expectation” is currently at 3%. While this was also the case in the late 1990s and the decade that followed before the GFC, with markets during those periods not necessarily worried that the Fed had lost control over inflation, it is important to consider that the notion of neutral rates would have been a lot higher than 2.5%. In fact, the lowest the Fed Funds Rate got to in that period was 2.5% and was at that level only briefly.
Our takeaways of this situation are the following, firstly, if the neutral rate is higher than previously thought then rates should be higher for longer. The journey from restrictive to neutral territory is shorter in this case and the new equilibrium will be at a more elevated level. Secondly, the scope for US Treasuries to rally in the non-base case of a hard landing would be more limited than otherwise. This is particularly true at this juncture where the curve is already heavily inverted. This is not to say that rates would not protect portfolios in such a scenario but it’s just an observation that the smaller the range between the 10Y UST yield and the neutral rate, the smaller the move lower in yields should be when the cycle ends.
In our opinion this neutral rate could easily move up to 3% given where short rates are now relative to history, and where inflation expectations have drifted to. So while we do like owning Treasury protection we see this as a small headwind to that potential performance.