CLOs: Lessons From The Past (Part 2 – Stress Testing)
Last week we looked at a 2018 CLO and a pre-crisis transaction both managed by Carlyle, to see how these deals compared and what the drivers for defaults were or might be.
In recent years we’ve written a lot about stress testing, which we have always found to be one of the most important things to do when underwriting new transactions. Our stress testing is typically split into two different analyses. The first is a more traditional way of looking at structures and considering how many defaults a structure can deal with at a range of different loss severities. The second is one we refer to as a “shock test”, where we essentially ask the “what can go wrong” question and run a default scenario at 1.5 times the shock seen in 2008-2011. We will try to do something similar here.
Last week the European Central Bank said the coming recession could be as deep as the one stemming from the 2008 crisis, and Germany’s Ministry of Finance has estimated that the German economy will shrink by at least 5% this year (so essentially the 2008 and 2009 GDP contractions together in one year). That said, one big difference for economies this time around may be the large and increasing stimulus programmes that are being put in place by central banks and governments around the world to protect companies and jobs. The German government is the latest to take the fiscal shackles off, agreeing a €750bn spending package on the same day the US Federal Reserve announced a range of measures that many in the market dubbed an ‘all-in’ move. While the market hasn’t responded particularly well to any of these packages so far, they will have an impact on the ability of businesses to service their debt in the medium term, and give them some breathing room to weather the COVID-19 storm.
Keeping this in mind, we can start looking at what could happen if these packages are not sufficient (or simply too late) to avert a 2008-2011 style recession, and we can test where different levels of seniority would take a loss in that scenario. It is important to note that this is not our base case, but it is a good starting point for giving an insight into how we answer the “what can go wrong” question. I realise that this is relatively technical, so for those just interested in the possible results, you can scroll to the last paragraph.
For consistency’s sake we will use as an example the same CLO that we discussed in the previous blog, Carlyle’s CGMSE 2018-1 transaction.
The facts:
- Priced in March 2018
- The deal can reinvest proceeds from loan maturities and prepayments until October 2022
- Non-call period until October 2020, though call is unlikely to be exercised
- Currently CCCs in pool at 2.7% (March 2020 report), compared to a 7.5% limit (breaching this can ultimately lead to a diversion of equity note income to protect bondholders)
- Defaults: 0%
- Number of assets: 160
- Senior secured obligations: 97.9%
- Largest geographical exposures: 18.2% US/Global, 17.8% France, 14.4% Netherlands, 14.1% UK, 11.5% Germany
- Largest industries (via Moody’s): Banking/Finance 13.9%, 10.5% Healthcare, Construction 7.5%, Business Services 7.1%, Telecommunications 6.3%
For a shock test we add more stress on the names where we might expect to see haircuts, and the sectors likely to suffer under the current widespread lockdown of economies would include (but are not limited to) retail, hospitality, construction, aviation and companies with earnings sensitive to oil prices. We also make the rather draconian assumption that managers are not able to avoid the default curve, even though we saw during the last recession that CLO managers mostly outperformed the index and experienced much lower losses than the market as a whole. Since this is a shock test, we like to be conservative.
There are a few assumptions to make, as the manager still has the ability to reinvest for 2.5 years:
- Prepayments will drop to levels seen during the GFC and not recover for a few years
- Underlying collateral will be downgraded by the rating agencies (the median in 2010 was around 12%), but as B- exposure is higher now than it was then, we can assume this level will also be higher
- Defaults will lag downgrades to CCC, but will increase back to GFC peak levels and we will see a second wave of defaults a year before the current loan maturities (in reality this might be tempered due to central bank and government actions, but this is similar to comments from ratings agency S&P, and again, this is a stress test)
- Loss severity increases during the recession to 45% (from the historic ~25%) on senior secured loans
- The manager will be able to reinvest cash into discounted assets (The S&P European Leverage index currently trades at a cash level of 80.37) to create additional support for the transactions
- We expect loan issuance to remain low for the coming 12 months
- The deal is never called, essentially applying the worst possible stress
Taking all this into account, the default curve for our basic shock test looks similar to what we saw during the GFC.
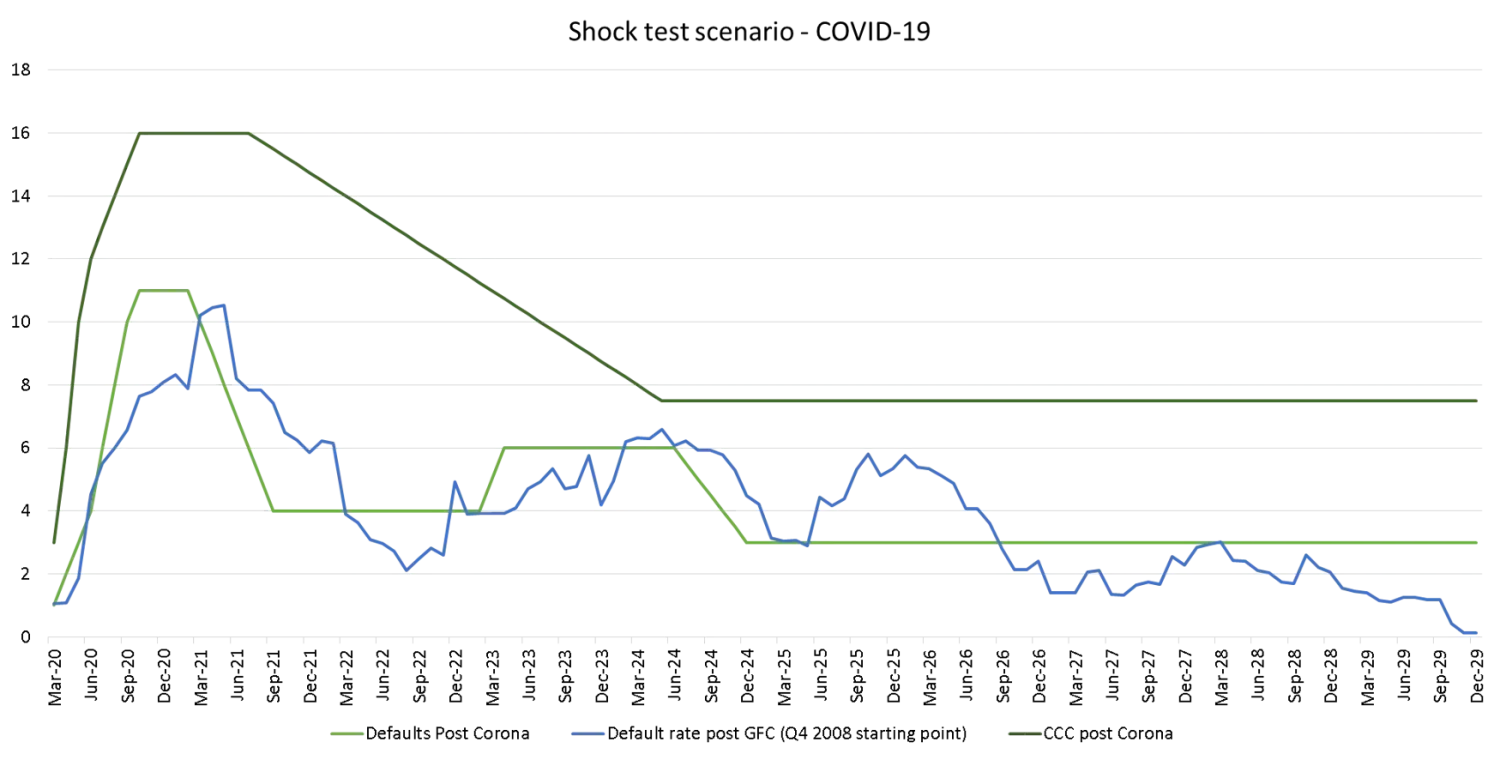
Source: TwentyFour, S&P ELLI Default index
This relatively benign test scenario results in 23% cumulative defaults over the life of the transaction. All rated bonds would get paid back at par and the BB/B interest would be at risk of short deferrals but paid in full, though downgrades are also likely. Equity holders don’t look to be in a great position in this scenario, but that is to be expected as this would be the first loss tranche and around 10-times levered.
| Class | Principal loss | Interest deferral | Weighted Average Life |
| AAA | 0% | 3.1yr | |
| AA | 0% | 5.0yr | |
| A | 0% | 5.6yr | |
| BBB | 0% | 6.1yr | |
| BB | 0% | 6 months (fully repaid) | 6.3yr |
| B | 0% | 18 months (fully repaid) | 6.7yr |
| Equity | 83% | 3 years (35% distribution paid) | 10.5yr |
But let’s take this one step further and look at where the most sensitive tranches (BBB, BB and B) would start taking principal losses. CLO performance data shows that pre-crisis deals were very resilient, with only 15 rated bonds reporting a loss (out of nine deals, according to S&P research from June 2019). For this we will leave everything the same but multiply the default curve by two. Note that double the same default curve doesn’t necessarily mean double the defaults, since the more defaults a CLO pool suffers the faster a CLO typically unwinds, so the cumulative defaults won’t be exactly doubled. As a back of the envelope calculation, the AAA notes can withstand pretty much all loans to default today with a 60% recovery rate, so this analysis is not interesting for the AAAs.
| Class | Multiple of COVID-19 default curve | Default peak and cumulative defaults |
| BBB | 2.4x | 26.4% peak / 46% total |
| BB | 1.9x | 20.9% peak / 38% total |
| B | 1.4x | 15.4% peak / 29% total |
This shows that for BBB bondholders to lose money we would need to see a default spike of over 25%, which is over 2.5 times higher than we witnessed during the global financial crisis, and for defaults to remain very high thereafter. For a bond which can essentially withstand almost half of the asset pool being liquidated over the life of the transaction, the support looks very high. Sub-IG also looks well protected, though performance would likely differ from deal to deal and manager to manager, as exposures are different and some deals have longer/shorter periods to reinvest proceeds and build up credit protection to offset defaulting collateral, and short interest deferrals for single-Bs in particular are not impossible. Equity does look very sensitive to a rapid slowdown, but some managers will be able to create value for equity investors by buying assets at very large discounts if they can avoid CCC downgrades and defaults that can result in equity distributions to be diverted to the rated debt investors.
Clearly this shock/stress test is a severe scenario, but given the uncertainties that COVID-19 has thrown our way, as debt investors we would rather be overly conservative. As we said at the end of Part 1 of this series, tough stress testing is one factor that can make us feel more comfortable holding CLOs through such periods of market volatility.
About the author

About the author
