The US Bond Market Recovery has also Outpaced Equities…with a Twist
Yesterday we showed that for European investors, what we speculated on back in March has come true; that the bond market did recover its losses far more quickly than equities, as shown below.
Chart 1: Asset Class Returns this century
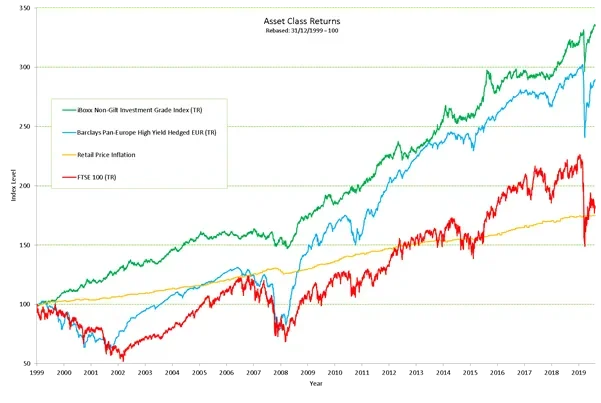
Source: TwentyFour, Bloomberg; as at August 10 2020. Past performance is not a reliable indicator of future performance. The value of an investment and the income from it can fall as well as rise as a result of market and currency fluctuations and you may not get back the amount originally invested. It is not possible to invest directly into an index and they will be unmanaged.
In summary from yesterday, the green line shows that Investment Grade credit has not only recovered all of its Covid related losses, but has actually gone further and marched into new highs for the asset class. High Yield, as shown by the blue line, has recovered most – but certainly not all – of its losses. And lastly, UK equities (red line) have struggled to recover even half of their losses, despite huge government support for the real macro economy and individual companies. The reasons for these performance differentials are explained in the above link from yesterday.
But how does this look for US investors?
The short answer is, in some ways the same, and in some ways very different.
Chart 2: US Asset Class Returns this century
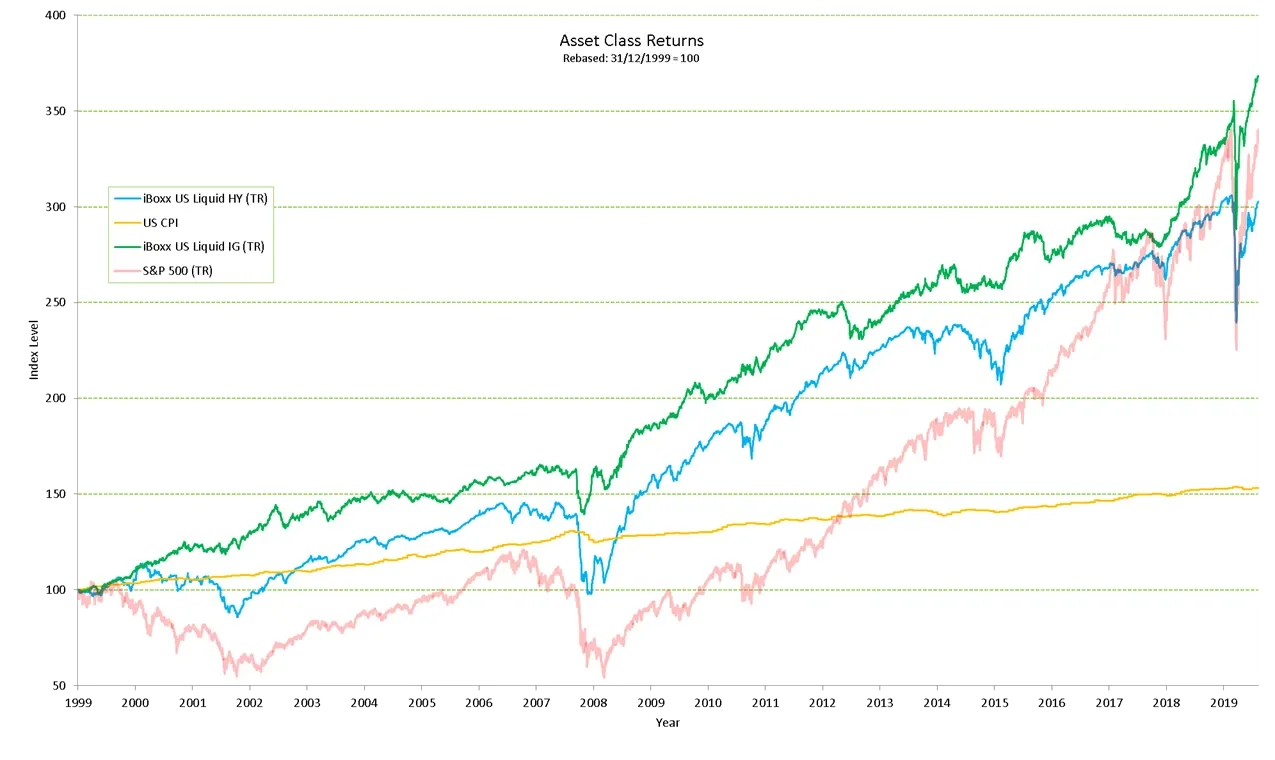
Source: TwentyFour, Bloomberg; as at August 10 2020. Past performance is not a reliable indicator of future performance. The value of an investment and the income from it can fall as well as rise as a result of market and currency fluctuations and you may not get back the amount originally invested. It is not possible to invest directly into an index and they will be unmanaged.
Again, like in Europe, Investment Grade credit has outperformed equities and HY on a nominal, real, and risk-adjusted basis so far this century. But in contrast to Europe, the recovery in equities as shown by the S&P 500 has taken valuations very nearly back to the peak, and whilst this is also true for HY, the S&P500 had outperformed HY prior to Covid, and this has been restored, despite far larger drawdowns.
So what could be the reasons for this difference with Europe? Firstly of course, income from equities is generally a bigger component of the return profile for European investors, with dividends being typically a smaller part of total return for US equities.
Which then leads on to a second question – which is, if income is less important, what has driven a large part of the capital growth? Here, it is illuminating to strip out from the S&P 500 the high growth FAANGM stocks (Facebook, Apple, Amazon, Netflix, Google (listed as Alphabet) and Microsoft).
As chart 3 shows, when these incredibly successful tech stocks are removed, the resulting 494 stock return profile does not look quite as incredible.
Chart 3: US Asset Class Returns this century, (S&P Ex FAANGM)
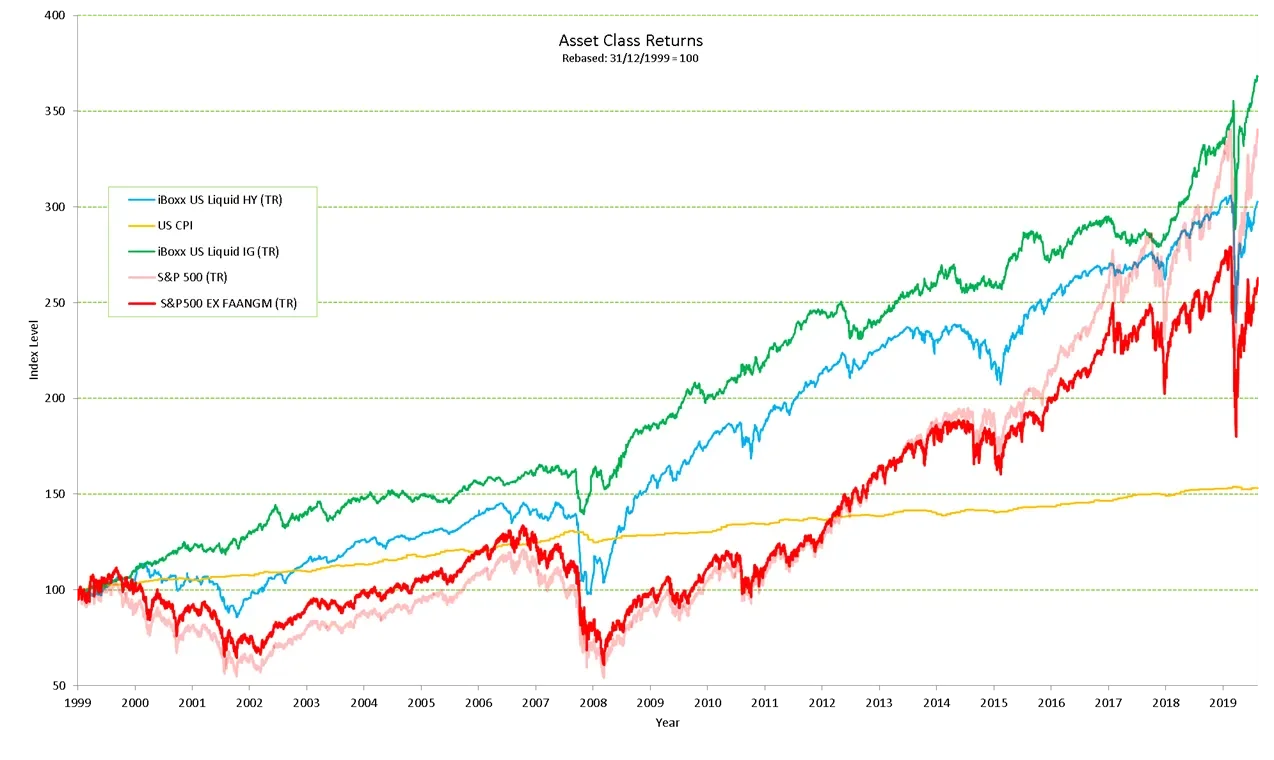
Source: TwentyFour, Bloomberg; as at August 10 2020. Past performance is not a reliable indicator of future performance. The value of an investment and the income from it can fall as well as rise as a result of market and currency fluctuations and you may not get back the amount originally invested. It is not possible to invest directly into an index and they will be unmanaged.
Here, the resulting picture is very similar to Europe.
IG has beaten HY, and both have beaten equities. Whilst equities have recovered the bulk of their losses, they have not quite got back to the previous high. And of course the recovery has not been as strong as HY, whilst IG has marched onto new highs. The removal of the six FAANGM stocks alone from the S&P 500 makes the US look very similar to Europe in terms of what is happening between debt and equity markets across corporate landscapes, tech titans aside.
This reaffirms our view that moving forward we believe the contractual nature of coupons versus the discretionary element of dividends means that predictable and attractive income should continue to be best provided from fixed income as opposed to equities. The income is “fixed” after all.
However all is not necessarily rosy in the world of debt. Government bond yields are close to all-time lows, in fact negative in many cases outside the US. Across developed markets, spreads on non-financial IG credit have retraced most of the widening seen in recent months, with corporate bond purchase programmes from central banks helping to further already strong rebound rallies.
Combining the two factors, low government bond yields and spreads that have narrowed, the all in credit yield in many non-financial sectors is now lower than it was in January and February of 2020. To put that in context, back in January and February we were arguing that within IG credit, the valuations were such that reaching for risk was not justified. Now we have even lower yields in some cases.
The main area of optimism for us in the IG space is financials. As we have blogged about several times recently, by and large banks and insurers have given a good account of themselves during this crisis, in stark comparison to 2008 where they were seen as a large cause of the crisis. Twelve years on, capital reserves is the best it has probably ever been across the developed banking sector, underwriting standards have been far better, meaning provisions have been remarkably low compared with what they could have been if the banks were in the same positon as 2008, emergency liquidity facilities exist to help ensure no bank goes bust for liquidity reasons, and lastly, in our view spreads still remain attractive.
From our perspective a good opportunity within IG credit, without having to take excessive risk, could be to buy legacy Bank and Insurance IG debt. From a valuation and fundamental credit perspective, our belief is that there are no better assets.
About the author

About the author
