Protecting a bond portfolio from duration and volatility
Fixed income investors globally face a huge challenge defending returns against rising rates and resurgent volatility.
The Federal Reserve’s famous ‘dot plots’ are projecting two more quarter-point rate hikes in 2018 and a further four in 2019, which if carried out would take the upper bound of the Fed Funds rate to 3.5%. Other central banks may be lagging on the path to policy normalisation, but the direction is set and in all likelihood the low yields of this cycle are now behind us.
Compounding the problem is bond market volatility, which has returned with a vengeance in 2018 after a long period of relative calm, as markets struggle to navigate an increasingly unpredictable geopolitical climate.
The first half of 2018 showed how bond portfolios can suffer in these conditions, trapped between the capital-eroding effects of rising rates and the mark-to-market misery of volatility.
However, there are certain bonds whose characteristics help them thread the needle between these risks, capturing most of the upside of broader fixed income indices, while suffering less of the downside and offering the potential for steady absolute returns.
The problem with fixed rated bonds
The two biggest risks facing global bond investors currently are interest rate duration and volatility, and a rocky first half of 2018 demonstrated the damaging impact of both.The first quarter saw a seismic sell-off in rates markets and a widening of credit spreads as market rate expectations jumped on strong economic data. That set fixed income up for an equally challenging second quarter, with 10-year Treasury yields peaking at 3.11% before rallying strongly as fears of a global trade war grew. This meant the one sector everybody wanted to avoid after Q1 – government bonds – was one of the few that contributed positively to fixed income fund performance in Q2, as a return to risk-off sentiment spurred a flight to quality.
Markets settled slightly over the summer as investors – and politicians – drifted off to the beach, but the risks that dominated that brutal first half remain in place.
Indicators point to investors not pricing in the four 2019 rate hikes shown by the Fed’s dot plots – perhaps for fear that the flattening US yield curve will force the central bank to slow its pace of tightening – but Fed chair Jerome Powell seems committed to following that path. The European Central Bank’s July policy meeting may have been a non-event, but President Mario Draghi at least hinted at a new tightening bias when he said downside risks to the inflation outlook were receding. Japanese 10-year government bond yields saw their biggest rise in two years on August 1 after the Bank of Japan made a marginal adjustment to its own stimulus measures, while The Bank of England went through with an August rate hike despite the lingering risk of a ‘hard’ Brexit.
Geopolitics, the other prime source of fixed income volatility so far this year, hasn’t gone away either. The biggest risk to the global economic recovery is a trade war, which still threatens to escalate. A ‘soft’ Brexit remains the most likely outcome for the UK, but negotiations face severe headwinds. The political crisis in Italy after March elections ultimately eased, but the resulting coalition between two populist Eurosceptic parties is fragile. Idiosyncratic risks in emerging markets like Turkey are also adding to the uncertainty.
We do not believe the second half will be as bad as the first. But we do think the current conditions mean average returns in fixed income overall could be negative in 2018.
How can investors make sure they are on the right side of that average?
We offered one solution – floating rate bonds, particularly assetbacked securities – in our recent whitepaper ' How to protect a bond portfolio from rising rates '. These assets are excellent at protecting capital, but since the vast majority of the global bond market is fixed rate, we need to consider which assets within the fixed rate market can offer similar protection.
Remove volatility from the equation
In our view, the answer is short dated, triple-B rated bonds.
To design a portfolio that would be shielded from the worst effects of both duration and volatility, you need to maximise a measure of risk-adjusted return called the Sharpe ratio – effectively the optimal mix of assets for earning the highest return per unit of risk.
And looking at data going right back to 1991, the ‘optimal portfolio’ would have been one that featured predominantly triple-B rated corporate bonds with a maturity below five years1.
In every one of the last 26 years, these bonds have produced positive absolute returns. Even in years like 1994, when the Fed raised rates by 250bp, or 2008, when credit spreads aggressively widened, this mix of short dated triple-Bs would have produced positive returns for investors.
Chart 1: Short dated triple-Bs versus broad IG Index, US Credit returns 1991 to 2017
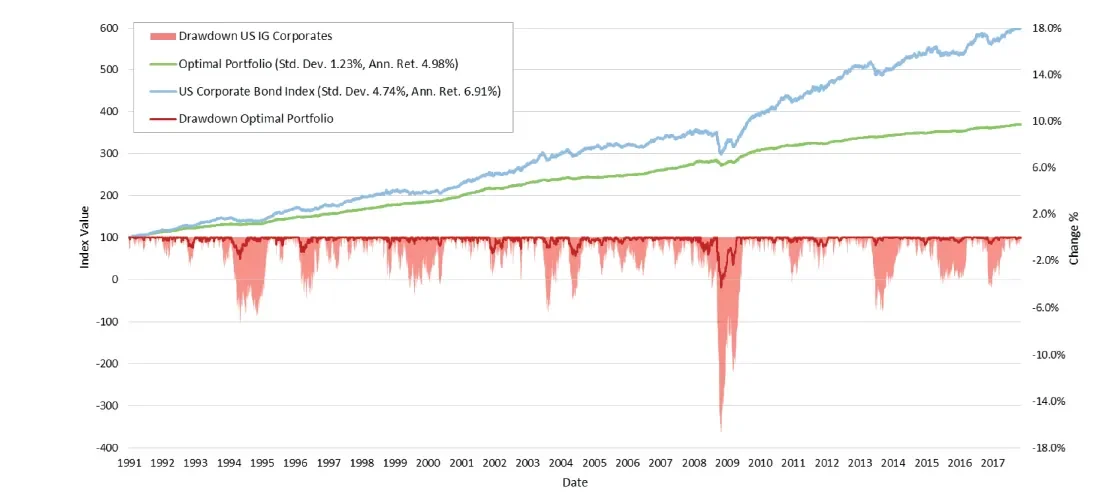
Source: TwentyFour, BAML, Jul 2018
If we compare the returns of this optimal portfolio (green line) with a broad index for US credit – in this case the BAML US Investment Grade index (blue line) – we see that it captures around five sevenths of the annualised returns of the broader investment grade index. But its drawdown profile is far smaller, and the recovery profile far quicker, as can be seen in the difference between the dark red line and the red area below the axis of Chart 1.
In other words, focusing on short dated triple-B rated bonds captured nearly all the upside of the broader US credit index, while avoiding the majority of the downside. As a result, the returns of the optimal portfolio, as shown by the green line, are remarkably smooth.
Even more remarkably, keeping duration low not only minimises volatility, it can actually keep returns positive as well. This is because the carry (yield) in short dated credit, plus a little bit of yield curve ‘roll-down’, tends to trump volatility over any reasonable time frame.
Our analysis shows that in the past 26 years, ‘reasonable’ could have been defined as any single calendar year.
Why credit beats sovereigns
Once volatility is contained, concentrating on IG credit with less than five years to maturity means mark-to-market losses from periods of stress do not have to feed through into negative total returns – since the annual yield on these short dated IG bonds normally exceeds the modest capital losses.
When the market environment gets really tough, like in 1994 and 2008, a further benefit is to be had from yield curve roll-down. Roll-down is simply the capital gain you get from owning bonds in a steep part of the yield curve: as time decays, the drop in yield translates into a modest capital gain, further adding to the yield. While rates curves can go flat, and even invert in some cases, credit curves tend to remain steep through the cycle.
Chart 2: UK Gilts vs triple-B IG Yields at the front end of the yield curve
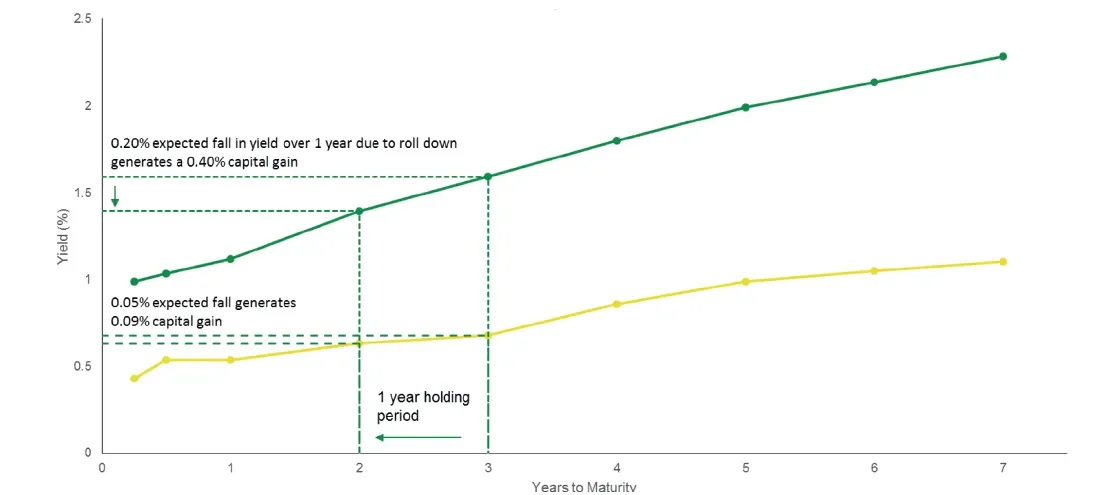
Source: TwentyFour, Jul 2018
For example, as Chart 2 shows, owning a three-year Gilt (yellow line) for one year results in only 9bp of capital gain. Contrast that with the equivalent trade on the dark green line of UK credit, which sees a far bigger yield drop between years three and two translate into a roll-down gain of 40bp. When yields are low, that type of gain can be a big factor in keeping returns positive.
This demonstrates how steep triple-B yield curves are your friend, particularly when duration is kept low. Roll-down gains can still be had when duration is high, but even in combination with the yield they may not be sufficient to offset capital losses from bouts of broader market volatility. Our research shows that even at the front end of the yield curve, where durations are lower, the steepness between individual years on the UK credit curve can still be significant enough to generate capital gains.
Decomposing the potential returns from the front end of the UK yield curve today (Chart 3) shows that in all cases, credit roll-down and credit carry can lead to significantly better returns than that from sovereign curves.
Chart 3: 1yr anticipated returns from the UK yield curve, triple-Bs vs Gilts.
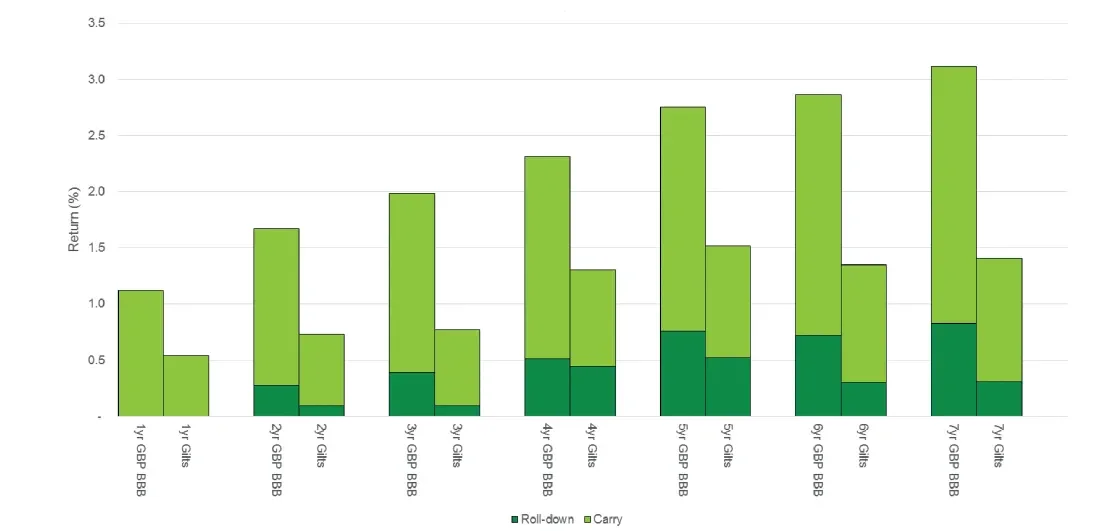
Source: TwentyFour, Jul 2018
The light green bar shows the carry return, while the dark green bar shows the roll-down impact. Given the current shape of the curve, roll-down gains at the six and seven-year part of the curve are not materially higher than the five-year. This is why we favour the five-year and lower part of the curve – volatility and potential capital threats are dramatically lower, while the return potential from roll-down is quite similar.Of course, yield and roll-down alone cannot guarantee positive returns in any calendar year, but they do a lot of the heavy lifting in getting you to that destination and go a long way to solving the problem of protecting capital and producing a good income.
Once that heavy lifting has been done, it is still possible to enhance the returns of such a short dated investment grade portfolio with some selective asset allocation and stock picking, though investors should be careful not to alter the asset allocation mix so aggressively that unwanted volatility or capital losses creep in. Small tactical allocations to markets such as floating rate asset-backed securities, BB-rated high yield bonds, and six and seven-year IG bonds from time to time can add a little flair for enhancing returns without changing the risk profile materially.
In the last three years, this optimal short dated triple-B portfolio has produced positive returns, with relatively little volatility, even while other fixed income approaches have struggled to combat the effect of seven Federal Reserve rate hikes.
At a time when fixed income investors globally are rightly concerned about the corrosive impact of rising rates, it is comforting to know that even within the fixed rate investment grade market, there is a mix of assets that can offer protection against these challenging conditions without giving up the potential for meaningful absolute returns.
1. To be exact, the Optimal Portfolio had 67.5% in 1-5yr bonds, with the rest in slightly longer dated bonds