Did Treasuries Know Something Equities Didn’t?
Although we are very much still in the grip of COVID-19’s impact, it has now been a month since the equity market’s trough and now would seem an opportune time to dissect some of the price action that preceded the unparalleled market turmoil in March.
While there were a handful of commentators who tried to sound the alarm early, financial markets largely ignored the threat of this new coronavirus until deaths soared and governments began taking serious action.
However, some parts of the market did begin to grasp the downside more quickly than others. The bond market certainly didn’t have a crystal ball and traded within typical ranges even through most of February, but examining the price action day-by-day in Q1 reveals that US Treasuries – the risk-off asset of choice for many investors – had grasped this downside earlier.
The US 10-year Treasury began rallying from the beginning of January, as indicated by the fall in its yield in the chart below (bond yields move inversely to prices). In doing so, the 10-year UST was suggesting an opposing view of macro risks to US equities, which continued rallying. As news of COVID-19’s spread in Asia became more widely discussed at the end of January, equities had a small pull-back but quickly recovered and pushed on higher. While the S&P 500 hit an all-time high on February 19, US Treasuries again faded this move and continued to rally. At this point the 10-year traded at a yield of 1.56%, only a shade above its all-time low (at that stage) of 1.46%, reached the previous September.
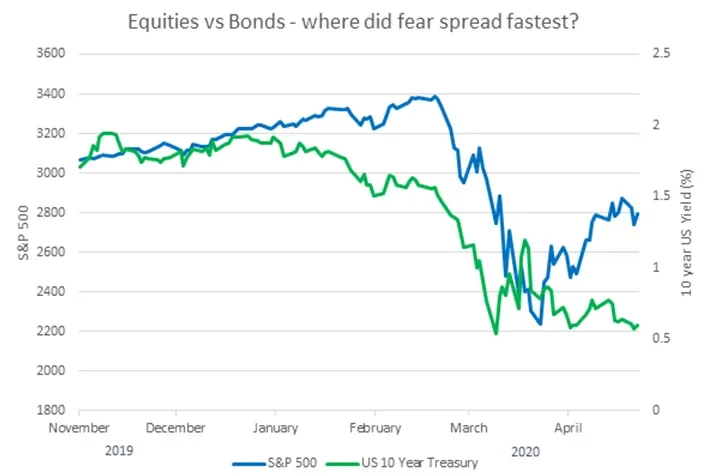
Source: Bloomberg
By late February, regions of Italy were being placed in lockdown and investors began to grasp the supply chain implications of how governments were responding to the virus. Equity markets experienced a sizeable correction, falling 14% in a week, but market price action remained orderly. Risk assets sold off but expectations of stimulus seemed to restrain investors from panic. Equities even enjoyed a small rebound during the first four days of March.
Absolute numbers of counted infections and deaths were still low at this point, but exponential growth does not take long to overwhelm any system and it appears the US Treasury market reached this conclusion a couple of weeks early. The 10-year yield never rebounded from its slide in mid-February, instead making new lows. By March 4 it had sunk to 0.59%, only 0.05% above its ultimate nadir, which arrived five days later. Based on yield, the US Treasury market reached maximum bearishness on March 9 at 0.54%, 14 days ahead of the S&P 500’s low on March 23. During those 14 days the S&P 500 fell another 22%, showing how much pain an equity investor might have saved themselves by taking the Treasury rally as a sell signal.
This certainly doesn’t mean government bond markets will be a reliable leading indicator of the next market crash. During the global financial crisis, for example, their predictive performance was mixed; the corporate bond market arguably gave a much clearer picture in 2007 of what was to follow.
What we can say is that the shape of government bond yield curves implies a lot about what the bond markets’ predictions are for the economy. Unfortunately, media attention is almost always focused on the gyrations of the equity markets, which can make it hard for anyone without a Bloomberg terminal to follow yield movements in major benchmarks such as US Treasuries, UK Gilts and German Bunds.
For those who would like a better view of these markets, we do send out the TwentyFour Daily Datasheet with charts showing daily, weekly, monthly and year-to-date changes in both government bonds and credit markets, along with trading ranges demonstrating the evolution of spreads over time (such as the one below).
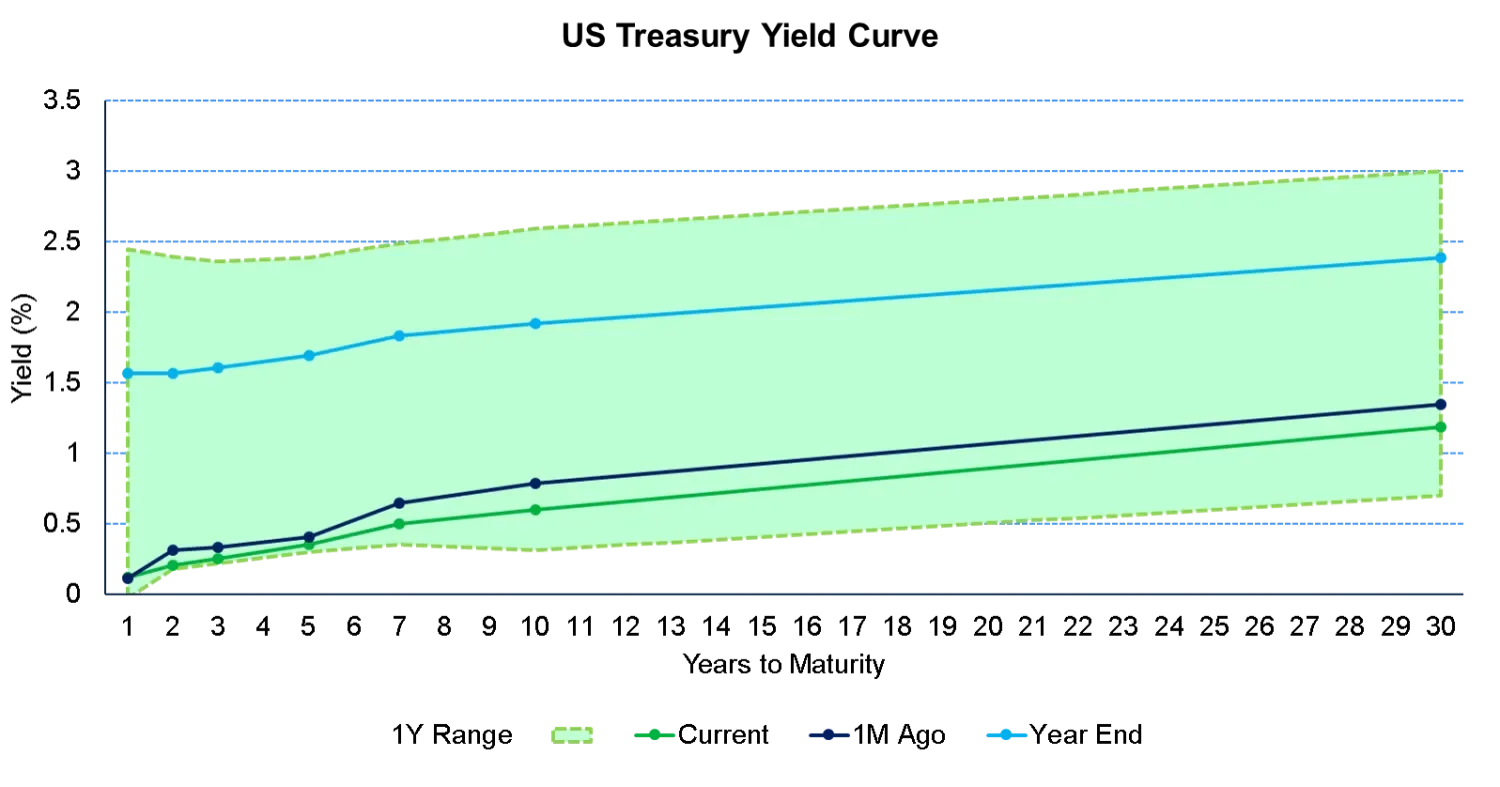
If you would like to receive the Datasheet, please email sales@twentyfouram.com and we will add you to the distribution list. We can’t promise that they will help predict the next pandemic-based recession, but they should give greater insight into some of the key metrics fixed income investors track on a daily basis.
About the author

About the author
