CLOs 5 years on
Five years ago, the European CLO market restarted when Cairn issued the first post-crisis CLO in Europe – the start of the 2.0 market – and after a slow first year we have seen plenty more CLOs coming to market from a large mix of legacy and new managers. As most readers will know, for a number of years now CLOs have been one of our favoured sectors within Fixed Income, and it was a key contributor to performance in the last year for example. When we consider performance, rate risk and tapering, we would argue that CLOs have become even more attractive as an alternative to corporate credit and they offer good diversity to what is largely a consumer debt backed European ABS market.
Let’s start with the current CLO landscape, according to Citi Velocity the outstanding balance of European CLOs is €93bn (notably there are only a handful of CLOs outstanding from the pre-crisis era) and this will likely go above €100bn soon as the 2018 primary expectation is roughly €20-25bn (vs ~€20bn in 2017). Although the European market isn’t nearly as big as the US market, €100bn makes it a large liquid market (of which ~80% is Investment Grade rated), and over 20% of the entire European ABS market. Currently we have 43 different CLO managers to choose from and it’s fair to say that there is a reasonable amount of price differentiation between managers and vintages, additionally, compared to 2013 almost every dealer will trade the product (indeed some are CLO specialists), vastly increasing liquidity.
Underlying performance has remained strong with a very low amount of defaults and CCCs in the underlying senior secured loans (1.1% defaulted balance down from 1.4%, and 2% CCC assets in the 4th quarter of 2017 down from 2.6% the previous quarter according to the recently published Fitch’ European CLO Index). Just to put these numbers in perspective, Permira priced their second European CLO last week and the A and BBB rated classes had a lot of structural protection (21% and 15.6% of subordination respectively, and an additional 2% of excess margin per year to cover losses), which means that at 35% loss severity (on loans), the BBBs can deal with over 13% of loan defaults every year; that’s almost 2 out of every 3 loans currently in the pool over the life of the transaction!
So there is a ‘proper’ market now, which performs well, but what about the yield? In the graph below we look at spread development in IG CLOs versus corporate credit (I have used the BofAML European 5-7yr Investment Grade corporate index). Obviously there are a few differences:
Rates: corporate bonds tend to be fixed rate, CLOs eliminate duration as they’re floating
Euribor floor: CLOs in Europe (post 2015) typically have Euribor floors on the coupons, adding roughly 0.3% of extra spread
Ratings: AAA-BBB for CLOs, but the average of the IG corporate index is A3 (Moody’s)
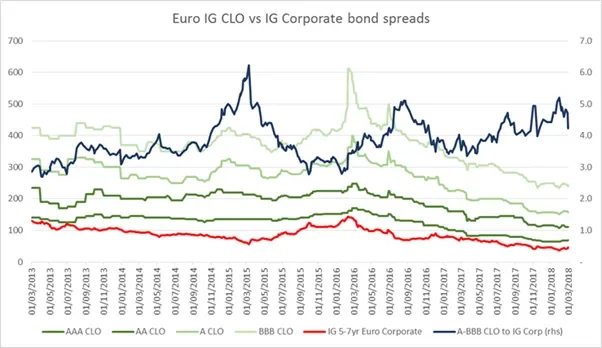
Source: Citi Velocity, BofAML, Bloomberg, TwentyFour Asset Management
First of all we can see that there is a certain degree of correlation, as you would expect; however, on a relative basis CLOs have become cheaper, mainly as they are not eligible for the various central bank purchase programmes. This means that tapering of the ECBs purchase programmes should present less risk for CLOs.
For the average A/BBB rated CLO bond you get paid (excluding benefit from a Euribor floor) 4-5 times the amount of spread (even AAA CLOs give you over 1.5x the spread). CLOs are liquid, but I wouldn’t argue that CLOs are as liquid as Investment Grade corporate bonds and they are more complex to analyse; but as always, if you are willing to do the work you are well rewarded for the research.