BBBs: Avoid At Own Risk
For fixed income investors, it has been impossible to ignore the proliferation of press coverage about the growth of the triple-B rated corporate bond market and the prospect of the next economic downturn sparking a wave of downgrades for companies rated BBB to high yield, with these ‘fallen angels’ exposing investors to mark-to-market losses at best, and defaults at worst.
BBBs have also been the subject of numerous queries from TwentyFour clients in recent months, which prompted us to conduct an extensive analysis of the sector in our new whitepaper, BBBs and ‘Fallen Angels’: Hellish Risks or Heavenly Returns?
In short, we think fears of a meltdown in BBBs are overdone. Here’s why.
Chart 1: Composition of IG Indices, 2003-2019

Source: TwentyFour Observatory
BBBs have undoubtedly become a larger proportion of investment grade corporate bond indices – from under 20% in 2003 to over 50% today (Chart 1).
The reason this expansion has caused concern is the suspicion that it has been driven by an increase in corporate leverage as firms have taken advantage of lower funding costs in the post-crisis decade, bringing more financial risks into the system and greater risks of losses for credit investors.
Our analysis, however, challenges this view.
First, we find no evidence of corporate leverage increasing in the last ten years (Chart 2).
Chart 2: Market value of GBP denominated corporate debt divided by market value of FT-SE All Share Equity Index
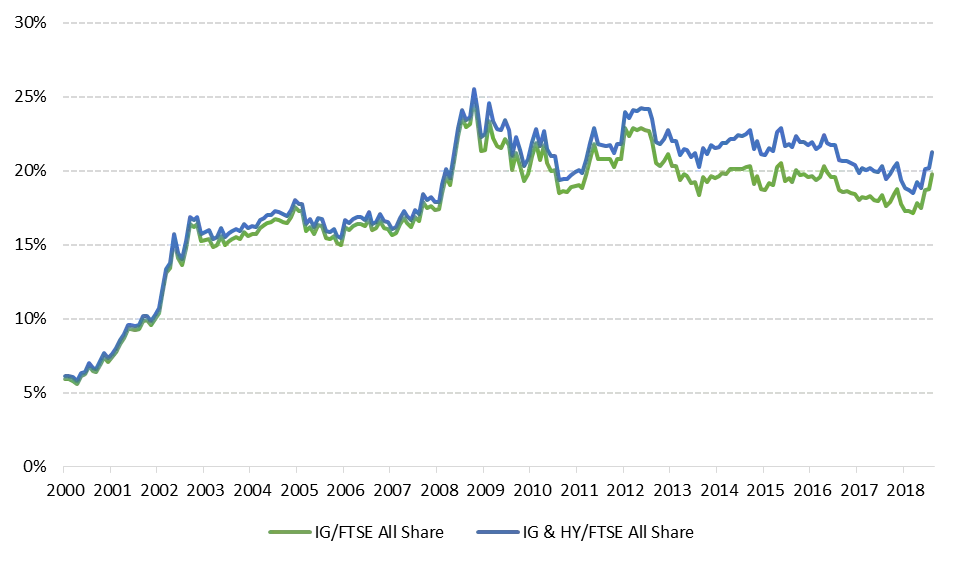
Source: TwentyFour, Bloomberg, BAML
Second, we find contradictory evidence on the cost of funding – the credit spread premium of BBBs over single-As has been significantly wider post-2008 than pre-2008 (Chart 3).
Chart 3: BBB vs A spreads, 2003-2019

Source: TwentyFour Observatory
So if leverage has not risen in aggregate, and spreads have not cheapened for BBBs relative to single-As, what explains the bulging bracket of BBBs?
Our suspicion is rating agencies have sharpened their pencils. It is clear to us that many bonds were ‘generously’ rated pre-crisis, and bonds that might have scraped an A- rating in the past might be BBB+ bonds today.
At the very least, we strongly believe that BBBs issued in the last ten years are no more likely to default than bonds issued 10, 20, 50 or 100 years ago. In fact, the peak year for IG and BBB defaults was actually 1938 (Chart 4).
A more recent peak for IG and HY defaults was of course 2008, with four cyclical peaks in defaults since 1970. I personally find the 1991 default experience worthy of further study given it was a cyclical downturn without ‘special’ monetary policy actions, which led to a greater level of BB defaults than in 2008, but a lower peak level of HY and IG defaults. Even then, however, BB defaults have never eclipsed 4% in any single year since the 1930s.
Chart 4: Annual Issuer Weighted Default Rates, 1920-2017
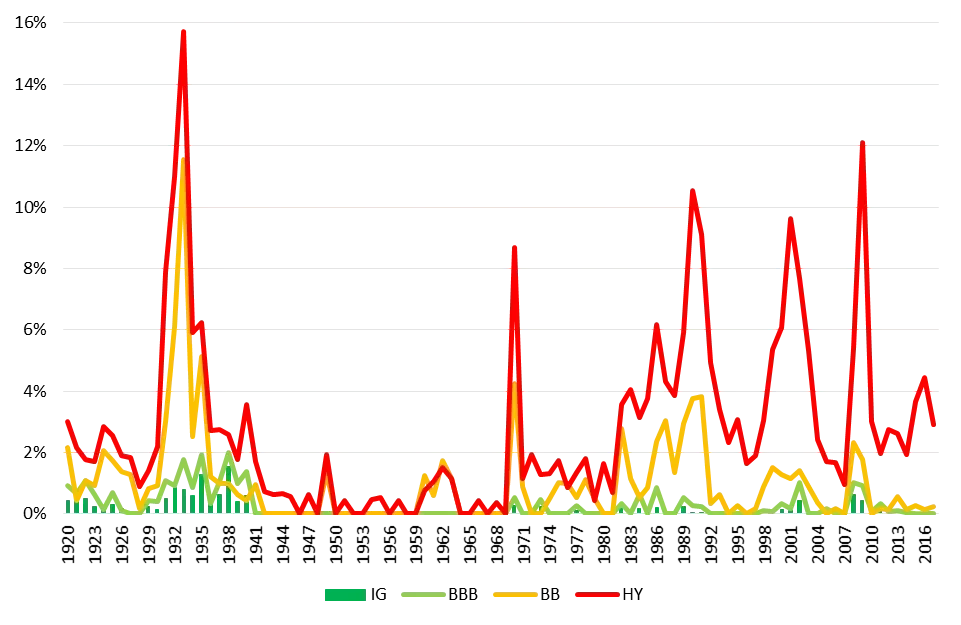
Source: Moody’s Default Study 2017, TwentyFour
What about multi-year downgrades and defaults?
Here, rating transition data from Moody’s is required reading. A detailed analysis of these also demonstrates that, by and large, the rating agencies mostly call it right. Over a five-year period, using data from 1970 to 2017, BBBs are downgraded to BB in 7.96% of cases.
Being downgraded to single-B happens in 2.55% of cases. Multiplying the probability of downgrade by the probability of default gives us 34bp of expected losses for BBBs that ultimately become BBs and then default, and 33bp of expected losses for BBBs that ultimately become single-Bs and then default.
This means an investor 100% passively invested in BBBs for five years could expect losses limited to around 0.67%. That figure discounts any active management: no hedging, no asset allocation shifts, no active stock selection, and no sales of downgraded bonds.
What happens to prices when bonds are downgraded?
Telecom Italia became one the largest ever fallen angels when it was downgraded in 2013, with some €27bn of the firm’s debt becoming high yield.
Chart 5: Telecom Italia EUR short, medium and long dated bond examples
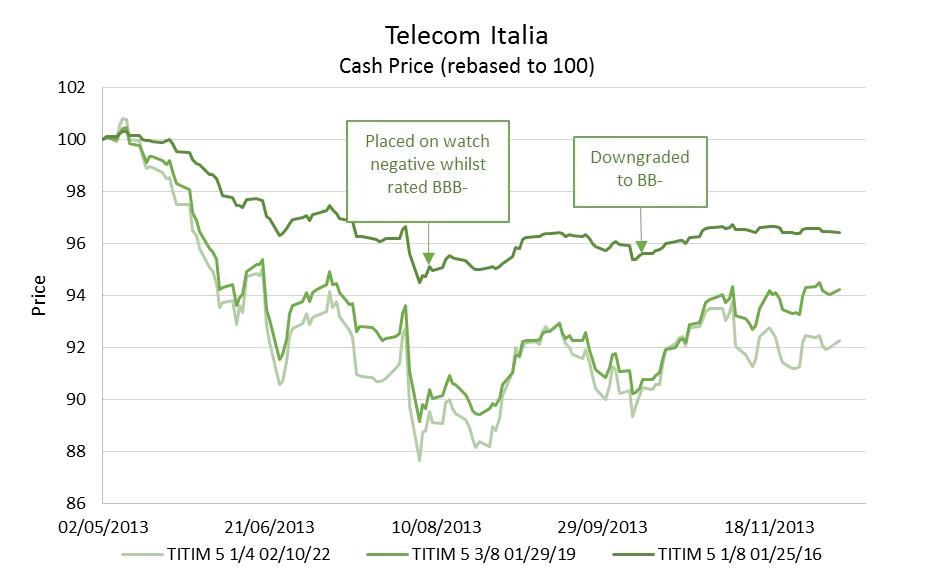
Source: TwentyFour, Bloomberg
The bond market tends to price in downgrade risks long before they actually happen – in fact, the market prices in the ‘watch negative’ warning from the rating agency before it happens, with a general recovery in prices after that point (Chart 5).
Bond maturity, or more specifically spread duration, is also clearly a key predictor of actual mark-to-market losses. The higher the spread duration, the more investors have to lose on any potential downgrade. If an investor keeps spread duration low, mark-to-market capital losses can be contained to levels often below the income generated by that same bond.
For the sake of brevity, though, let’s finish with what we see as the two greatest features of BBBs: total returns and risk-adjusted returns.
Chart 6: Total Returns of all 4 IG GBP ratings bands, 1996 to 2018
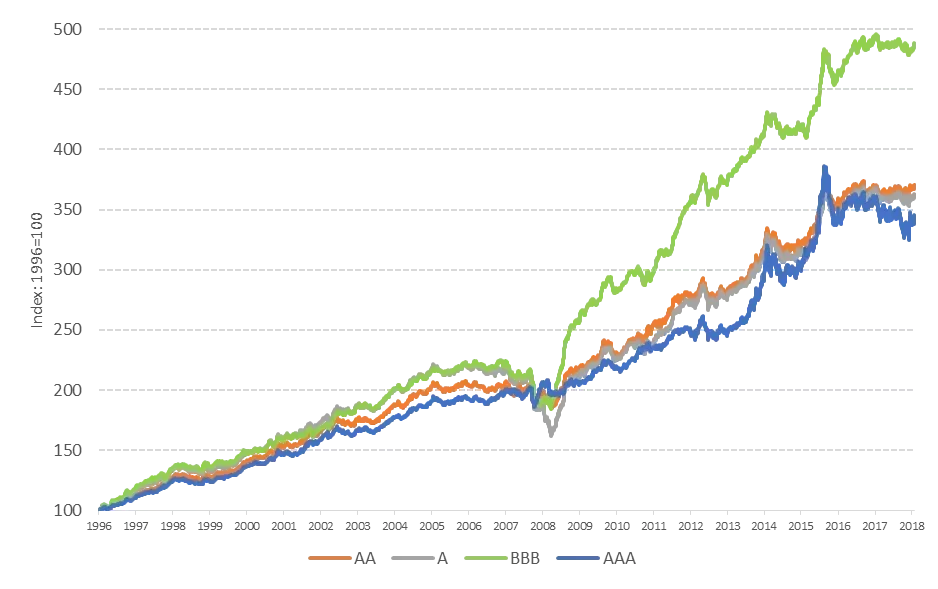
Source: TwentyFour, underlying data BAML
Prior to 2008, and especially since, BBBs have materially outperformed everything else in IG (with more than 100% additional return). Also worth noting is that in the last five years, AAAs have had lower and more volatile returns than BBBs.
When it comes to risk-adjusted returns, nothing comes close to BBBs through the investment cycle.
Chart 7: Annualised risk versus return for 204 European iBoxx indices, 2000-2014

Source: TwentyFour, underlying data iBoxx
We would strongly urge anyone interested in the expansion of BBB corporate bonds to read the full whitepaper, since it has significantly more background, detail and analysis on the sector, including on important characteristics like roll-down and liquidity.
BBBs do have inherent risks, and some are indeed elevated compared to other assets within fixed income. But being actively invested in BBBs can enable an investor to capitalise on their virtues, while avoiding the small subset of BBBs that become ‘fallen angels’ as far as possible. The risks are manageable and far outweighed by the benefits, in our view.
Our research shows these bonds have consistently produced the very best risk-adjusted returns across the global fixed income market. Avoid them at your peril.